Posts

Showing posts from January, 2013

downloading folders from google drive.

I wanted to download some course material on RL shared by the author via Google drive using the command line.  I got a bunch of stuff using wget a folder in google drive was a challenge. I looked it up in SO which gave me a hint but no solution. I installed gdown using pip and then used: gdown --folder --continue https://drive.google.com/drive/folders/1V9jAShWpccLvByv5S1DuOzo6GVvzd4LV if there are more than 50 files you need to use --remaining-ok and only get the first 50. In such a case its best to download using the folder using the UI and decompress locally. Decompressing from the command line created errors related to unicode but using the mac UI I decompressed without a glitch.
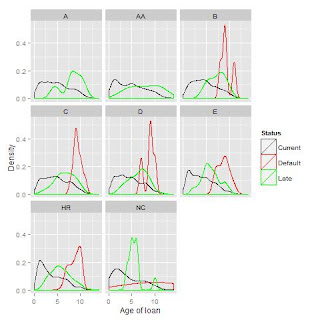
Business analytics - P2P loan data

Image
Analyzing an admixture of categorical and numerical variables. Trellis chart of loan age distributions faceted by clients' credit levels & loan status. This time I look at visualizing p2p loan data which is mostly categorical in nature (factors rather than numeric). While reproducing the charts in the book was somewhat challenging, I also went a step further and revealed some expected patterns as well as some surprising deviations. First I created the density plots. This was straight forward in R. I did decide to transform one of the variables with a log function. Since it had zero values those rows were dropped. So I added a minimal increment to all the values and got them back in. I had thought the graphs were not so elucidating so I explored them further and when I faceted them further into trellis graphs (by credit ratings) some interesting patterns started to emerge. These charts provide a high grain view of the data. One can easily interprets the interplay of 4

Business analytics - plotting Geo-tagged data

Image
In this section the challenge is to explore data comparing digital and traditional media options. The digital media is priced differently from the print. I think that this is not the clearest visualization in the world. But it made for a great learning experience. To create the geographic plot I used the map package together with ggplot2  which is based on by + Leland Wilkinson's  book The Grammar of Graphics . I had read the book in 2007, but found it disappointing that the system had been used only in a propitiatory format. However ggplot2  brought this powerful idea into the opensource world or R. After researching a number of options I eventually decided using ggplot2 . I preferred it since it ended up reducing the code to simple and clean form. As you can see I've improved the documentation format to include loading and installation of required packages. Geo-Tagged sales (digital are in red paper are black) I ended up with a small annoyance - the center of th

Business analytics - Time series analysis - Retail data

Image
Working with Soft drinks sales data (Section 2.3) The images produced to analyze the time series are not standard R graphics. As such I needed to dig a little deeper to replicate them. The were two tricks required to replicate this, How to draw one plot over another. How to use the same axis definition for all three plots. (these are hard coded). While researching this I noticed that thi=s example does not even scratch the surface of R's capabilities for handling time series. However perhaps these are covered later. Anyhow here is the image As explained the sales figure can be seen to have a periodic element and growth element - possibly exponential. Plotting the simpler unenhanced plot side by sided requires the layout command. I may do this later, but now it is time to move on. Further reading Data galore: Time series Data Library R as a Tool in Computational Finance by +John P. Nolan a little book of R for time series  by   + Avril Coghlan Introducto

Business analytics - Direct marketing data

Working with Direct marketing data (Section 2.2) This section discusses exploring data using data transformation, trellis graphs and using a scatter-plot matrix  explore direct marketing data. My own experience doing direct marketing campaigns for real estate was that we did not have such data-sets to work with - just lists of leads based on internet based research which yielded extensive data sets but of a sparser nature. Contacting the Postal authority did offer to us a service where based on a confidential dataset they allowed clients to send direct mail to clients according to some many criteria. However they could not provide the size of samples in real time nor did they provide the addresses - only the ability to send them letters for a fee. However their dataset was stale (3+ years old at best and they were going to renew it only in six months). Since the data was old and since there would be no way to check the reliability of their service we passed them over. Anyhow wor

Business analytics - Working with real estate data

Working with real estate data (Section 2.1) This section discusses exploring data using summary statistics, histograms and scatter-plots to better understand the data. Some of these tasks can be done using excel but it probably requires more work Most  of the Material in the sections 2.2 and later cannot be done using excel and requires a more powerful data handling  package like R or the commercial packages like SPSS, SAS, Matlab etc. Loading, viewing and summary statistics Generate histograms Creating a box plots for the prices etc.: Creating a scatter plot for the prices against apartment size: I used this webiste to get these samples together. I also work with The R book by +Michael J. Crawley 

Popular posts from this blog

Moodle <=< Mediawiki SUL integration - first thoughts

downloading folders from google drive.

Insight into progressive web apps