Posts

Showing posts with the label Spineplot

downloading folders from google drive.

I wanted to download some course material on RL shared by the author via Google drive using the command line.  I got a bunch of stuff using wget a folder in google drive was a challenge. I looked it up in SO which gave me a hint but no solution. I installed gdown using pip and then used: gdown --folder --continue https://drive.google.com/drive/folders/1V9jAShWpccLvByv5S1DuOzo6GVvzd4LV if there are more than 50 files you need to use --remaining-ok and only get the first 50. In such a case its best to download using the folder using the UI and decompress locally. Decompressing from the command line created errors related to unicode but using the mac UI I decompressed without a glitch.
Business analytics - P2P loan data

Image
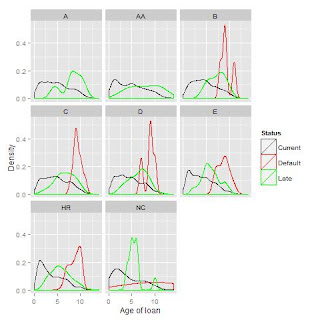
Analyzing an admixture of categorical and numerical variables. Trellis chart of loan age distributions faceted by clients' credit levels & loan status. This time I look at visualizing p2p loan data which is mostly categorical in nature (factors rather than numeric). While reproducing the charts in the book was somewhat challenging, I also went a step further and revealed some expected patterns as well as some surprising deviations. First I created the density plots. This was straight forward in R. I did decide to transform one of the variables with a log function. Since it had zero values those rows were dropped. So I added a minimal increment to all the values and got them back in. I had thought the graphs were not so elucidating so I explored them further and when I faceted them further into trellis graphs (by credit ratings) some interesting patterns started to emerge. These charts provide a high grain view of the data. One can e...

Popular posts from this blog

downloading folders from google drive.

Random Thoughts on Linear Regressions

SQL - Selection v.s. Projection